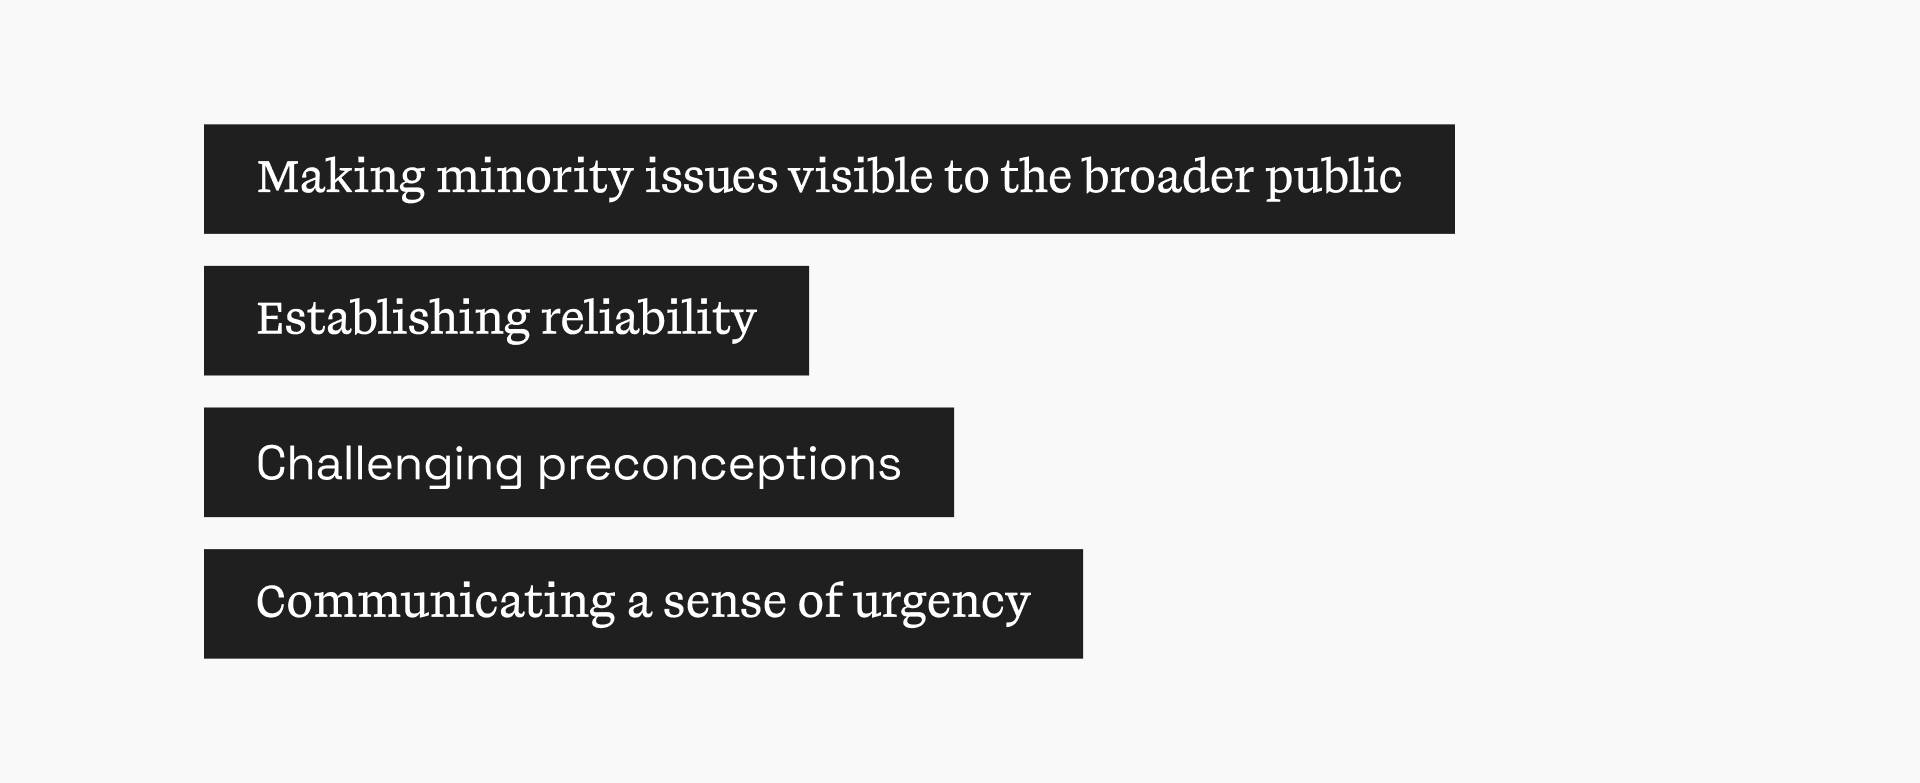
Challenges
Solutions
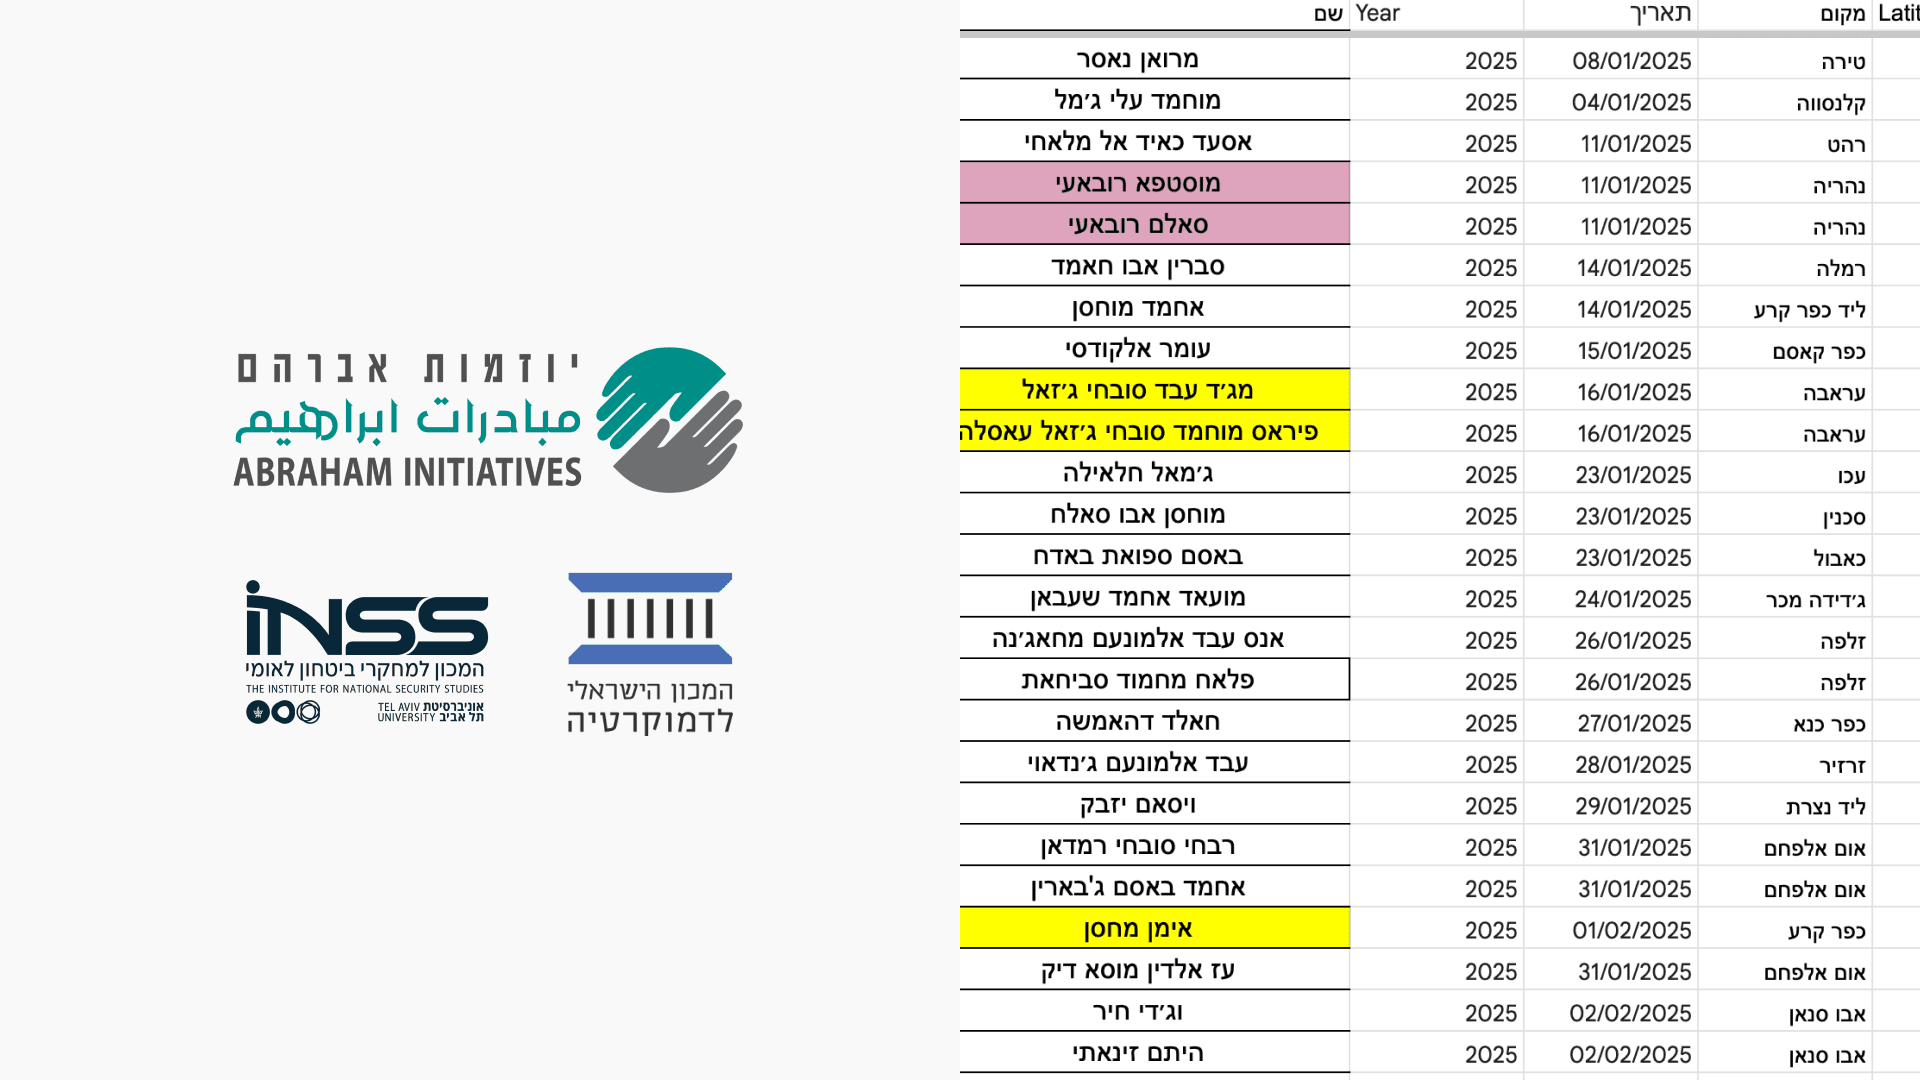
To establish reliability, I collaborated with the Abraham Initiatives and relied on trusted data sources.
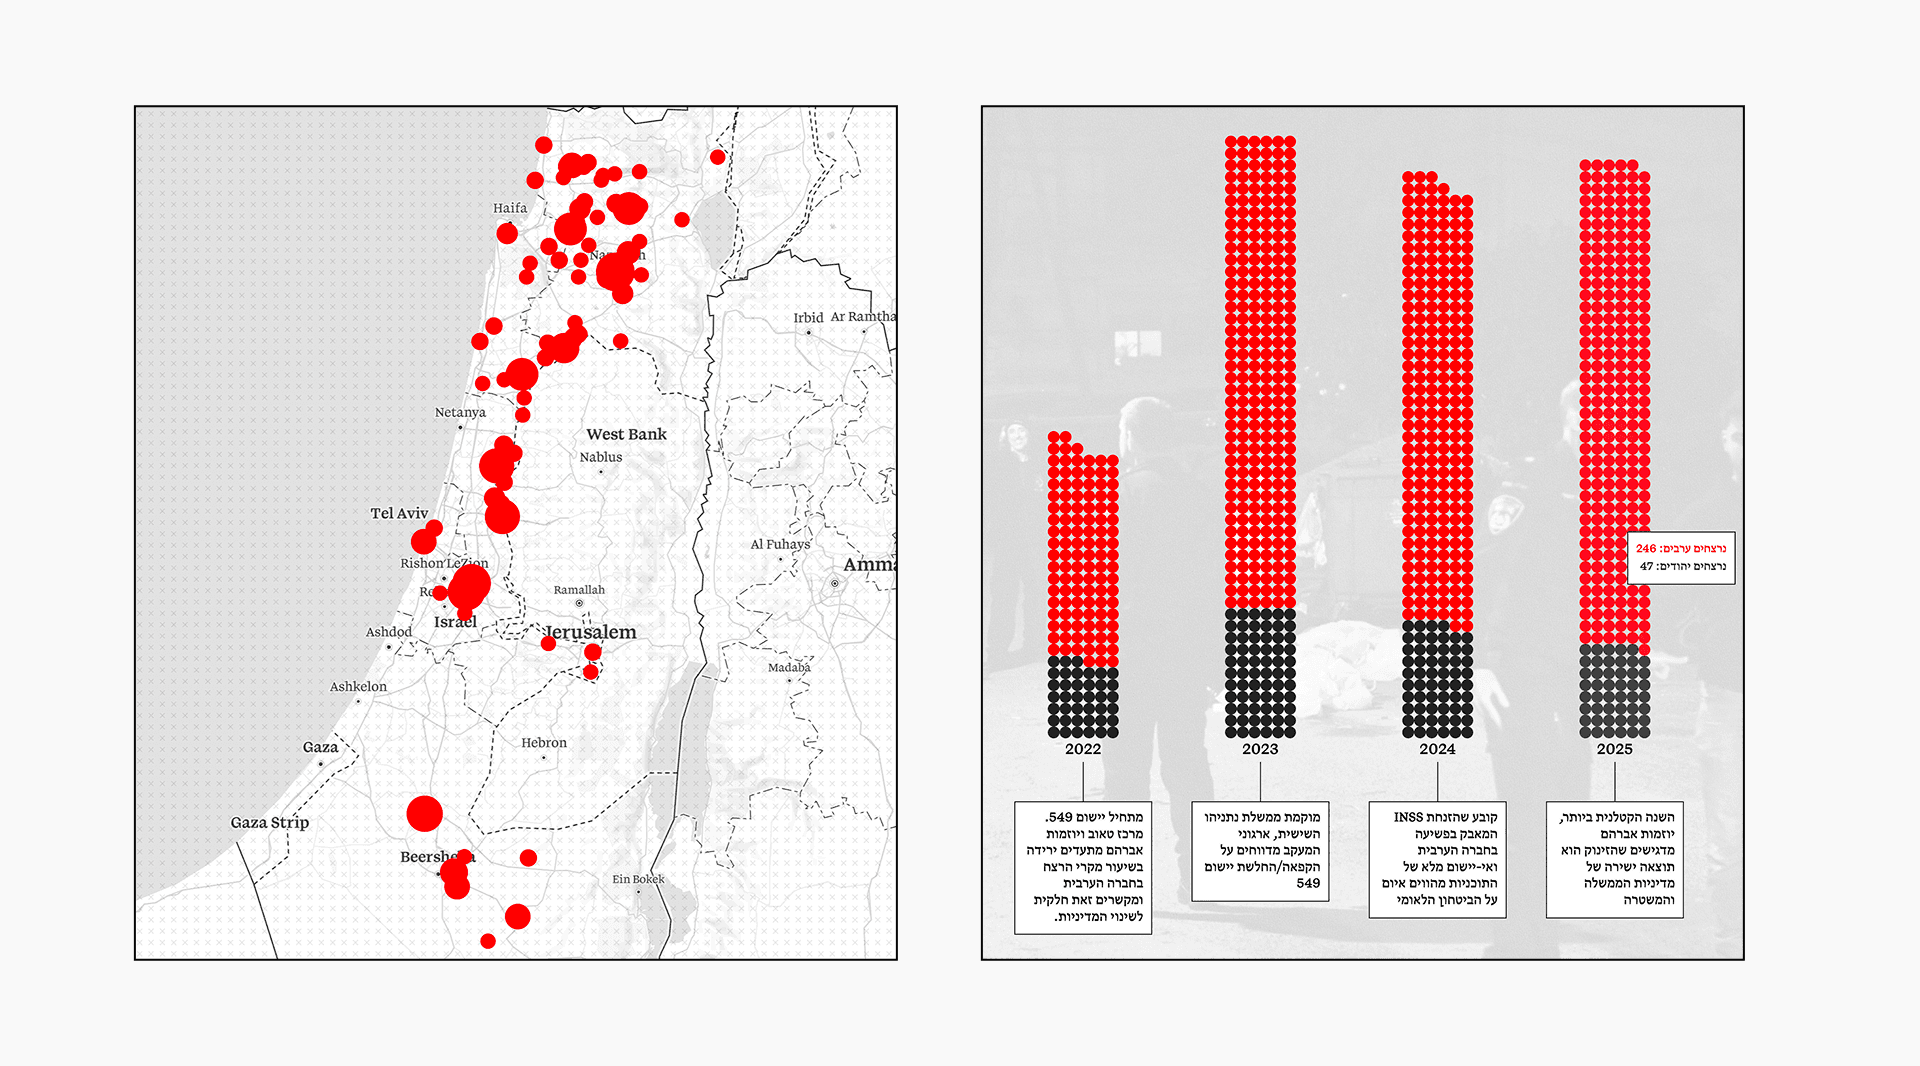
The collected data was translated into interactive infographics and visualizations, allowing users to explore and learn about the topic.
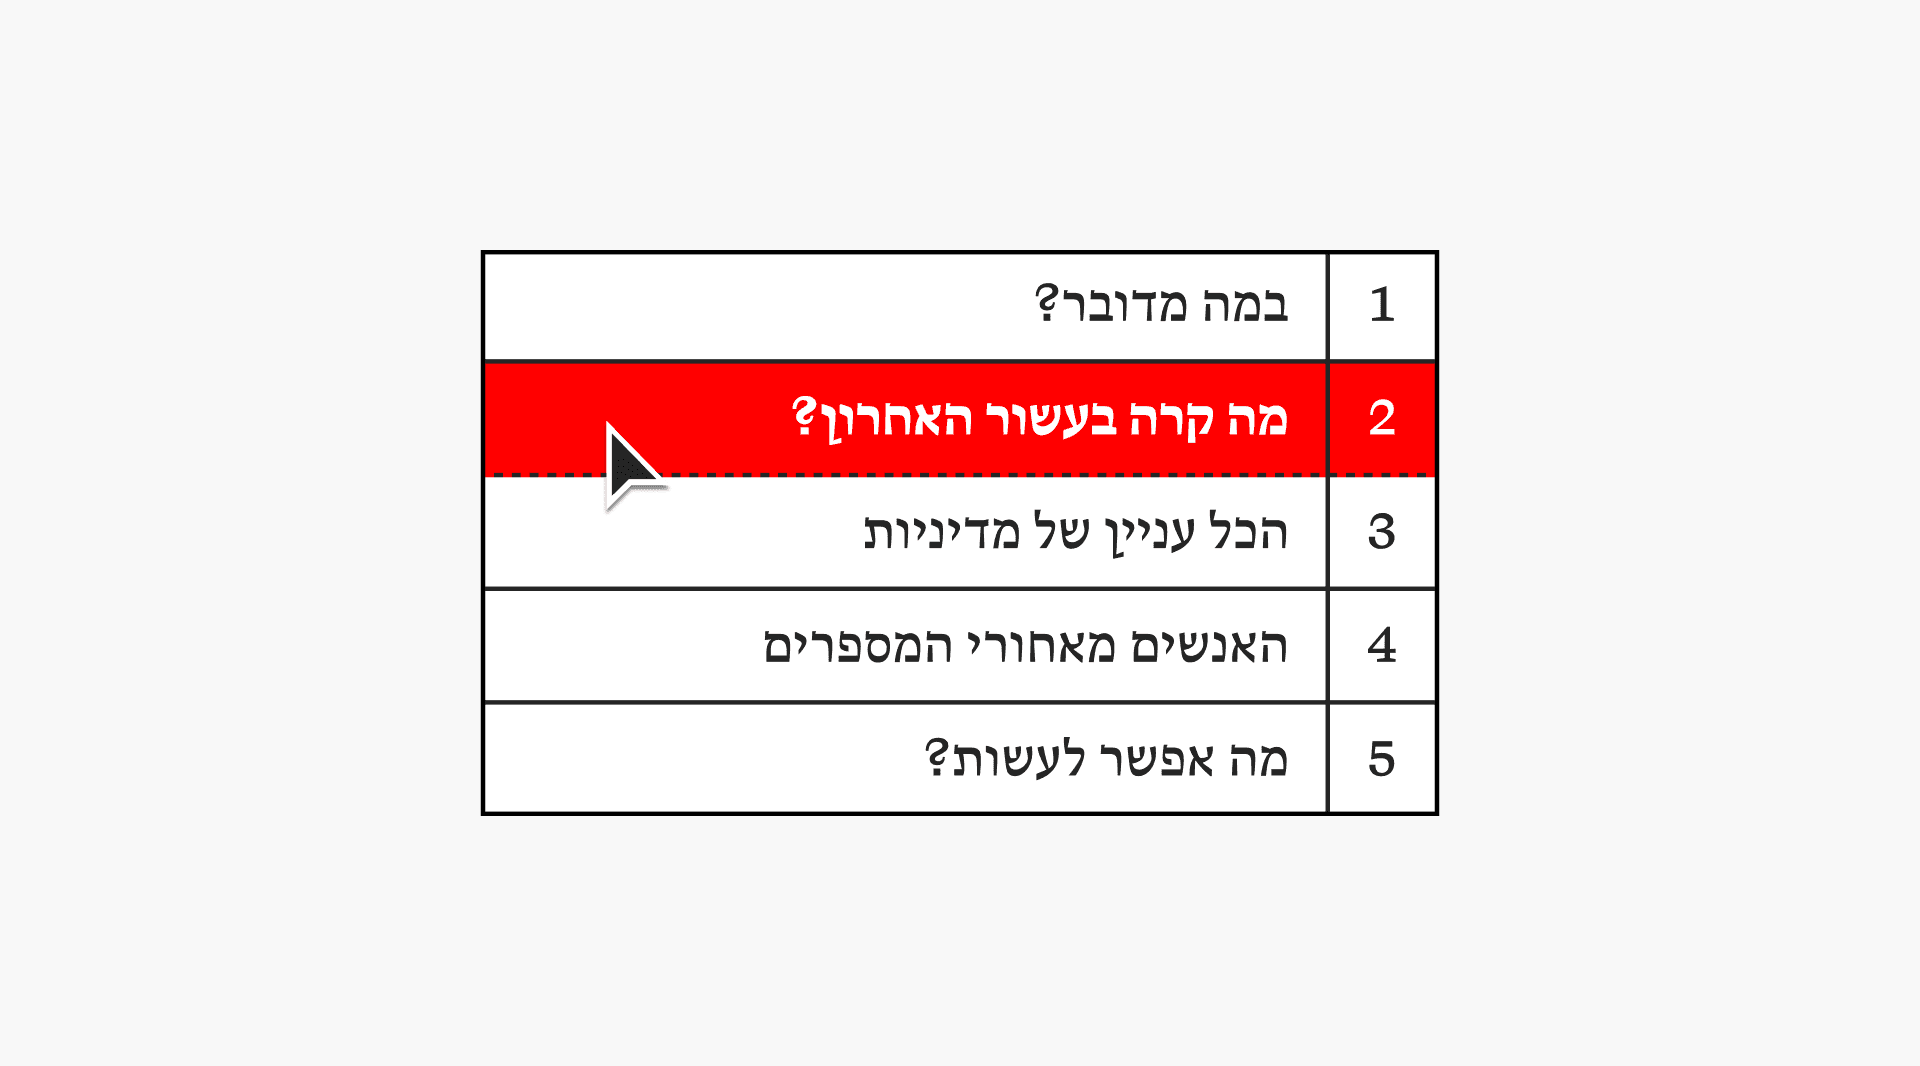
To challenge preconceptions and answer user questions, I designed a fixed side menu that provides guidance along the way.
To communicate a sense of urgency, I explored multiple compositions, color schemes, animations, and sound, tested them on users, and refined the final experience based on their feedback.
From Design to Vibe Coding
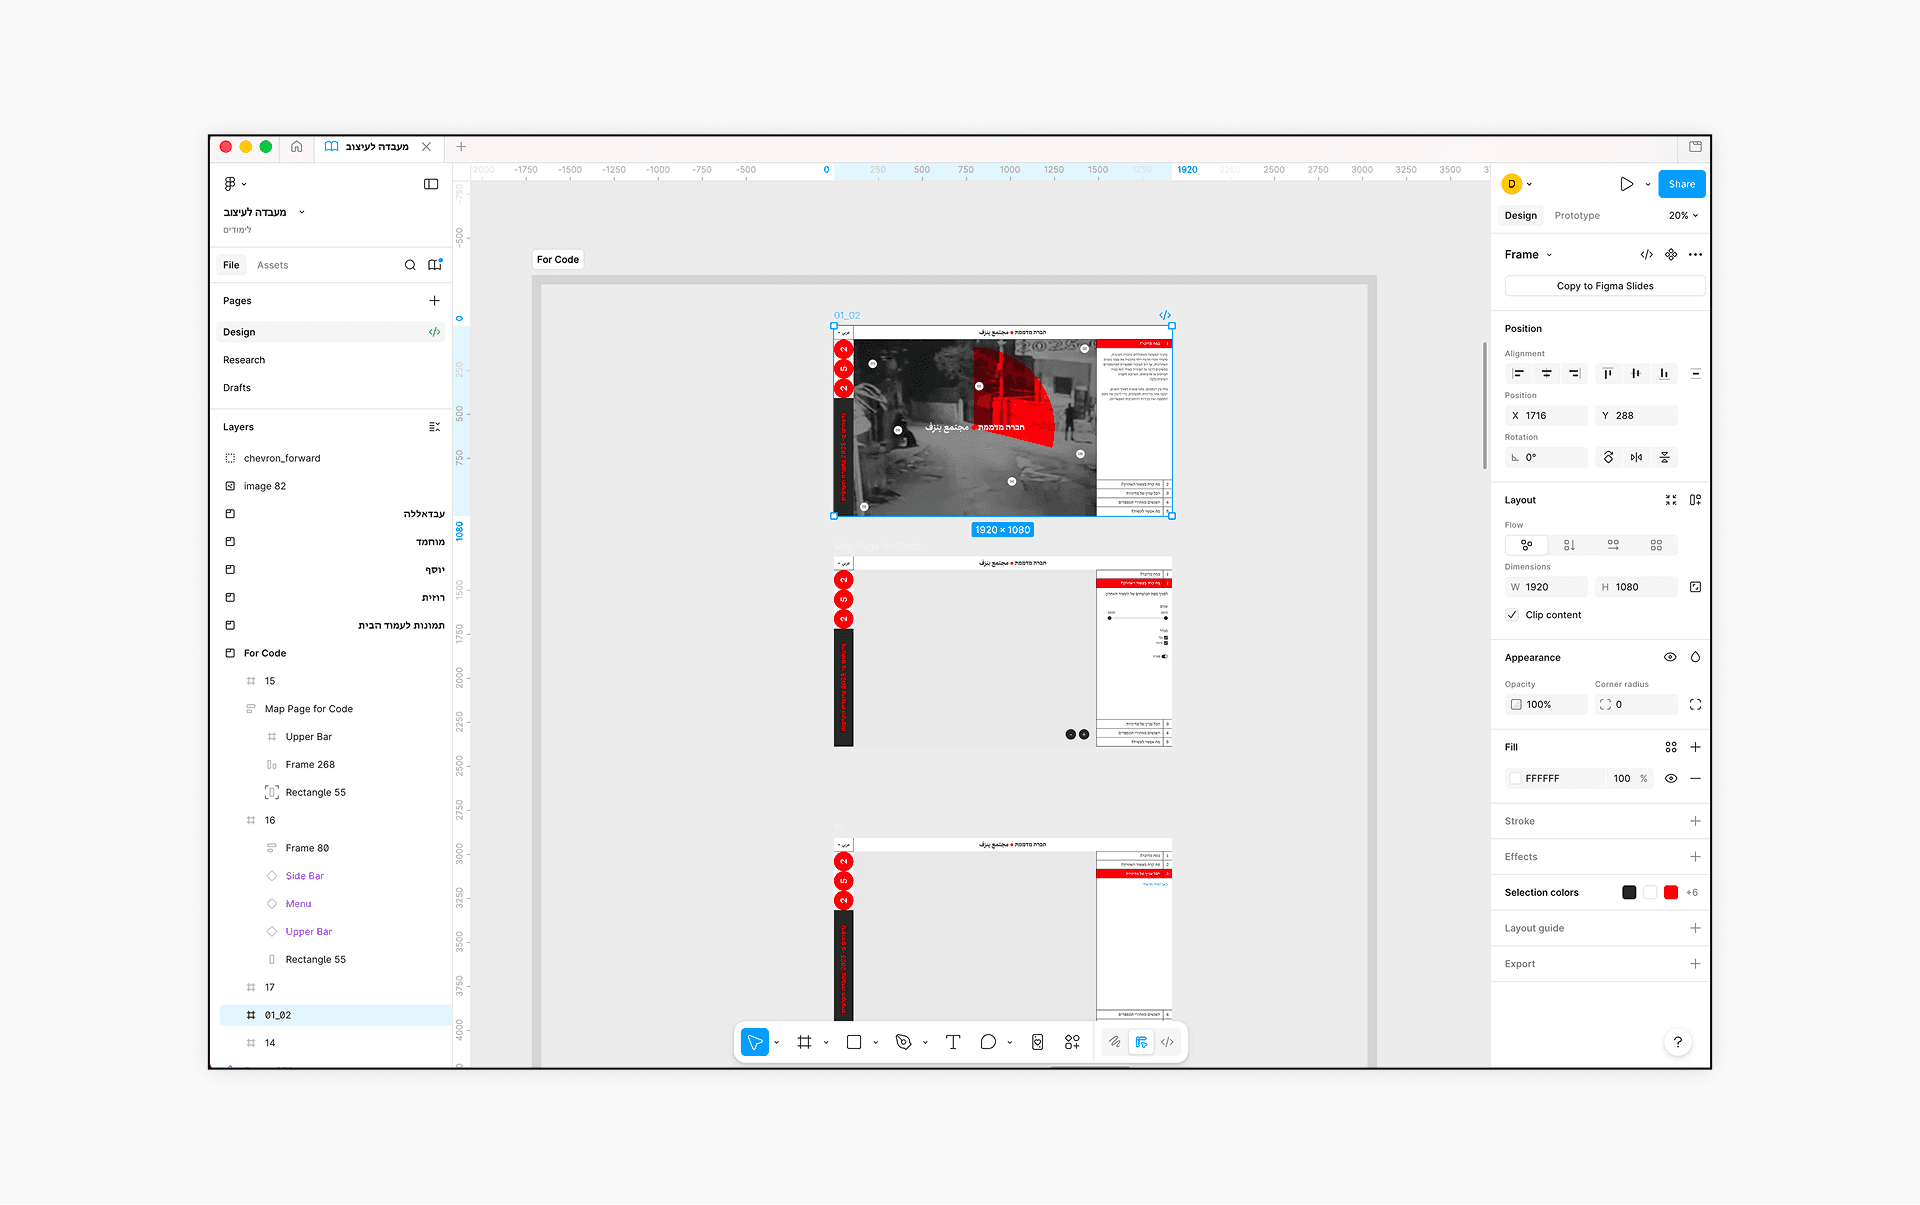
Once the final design was complete, I organized the frames and built a structured component library in Figma.
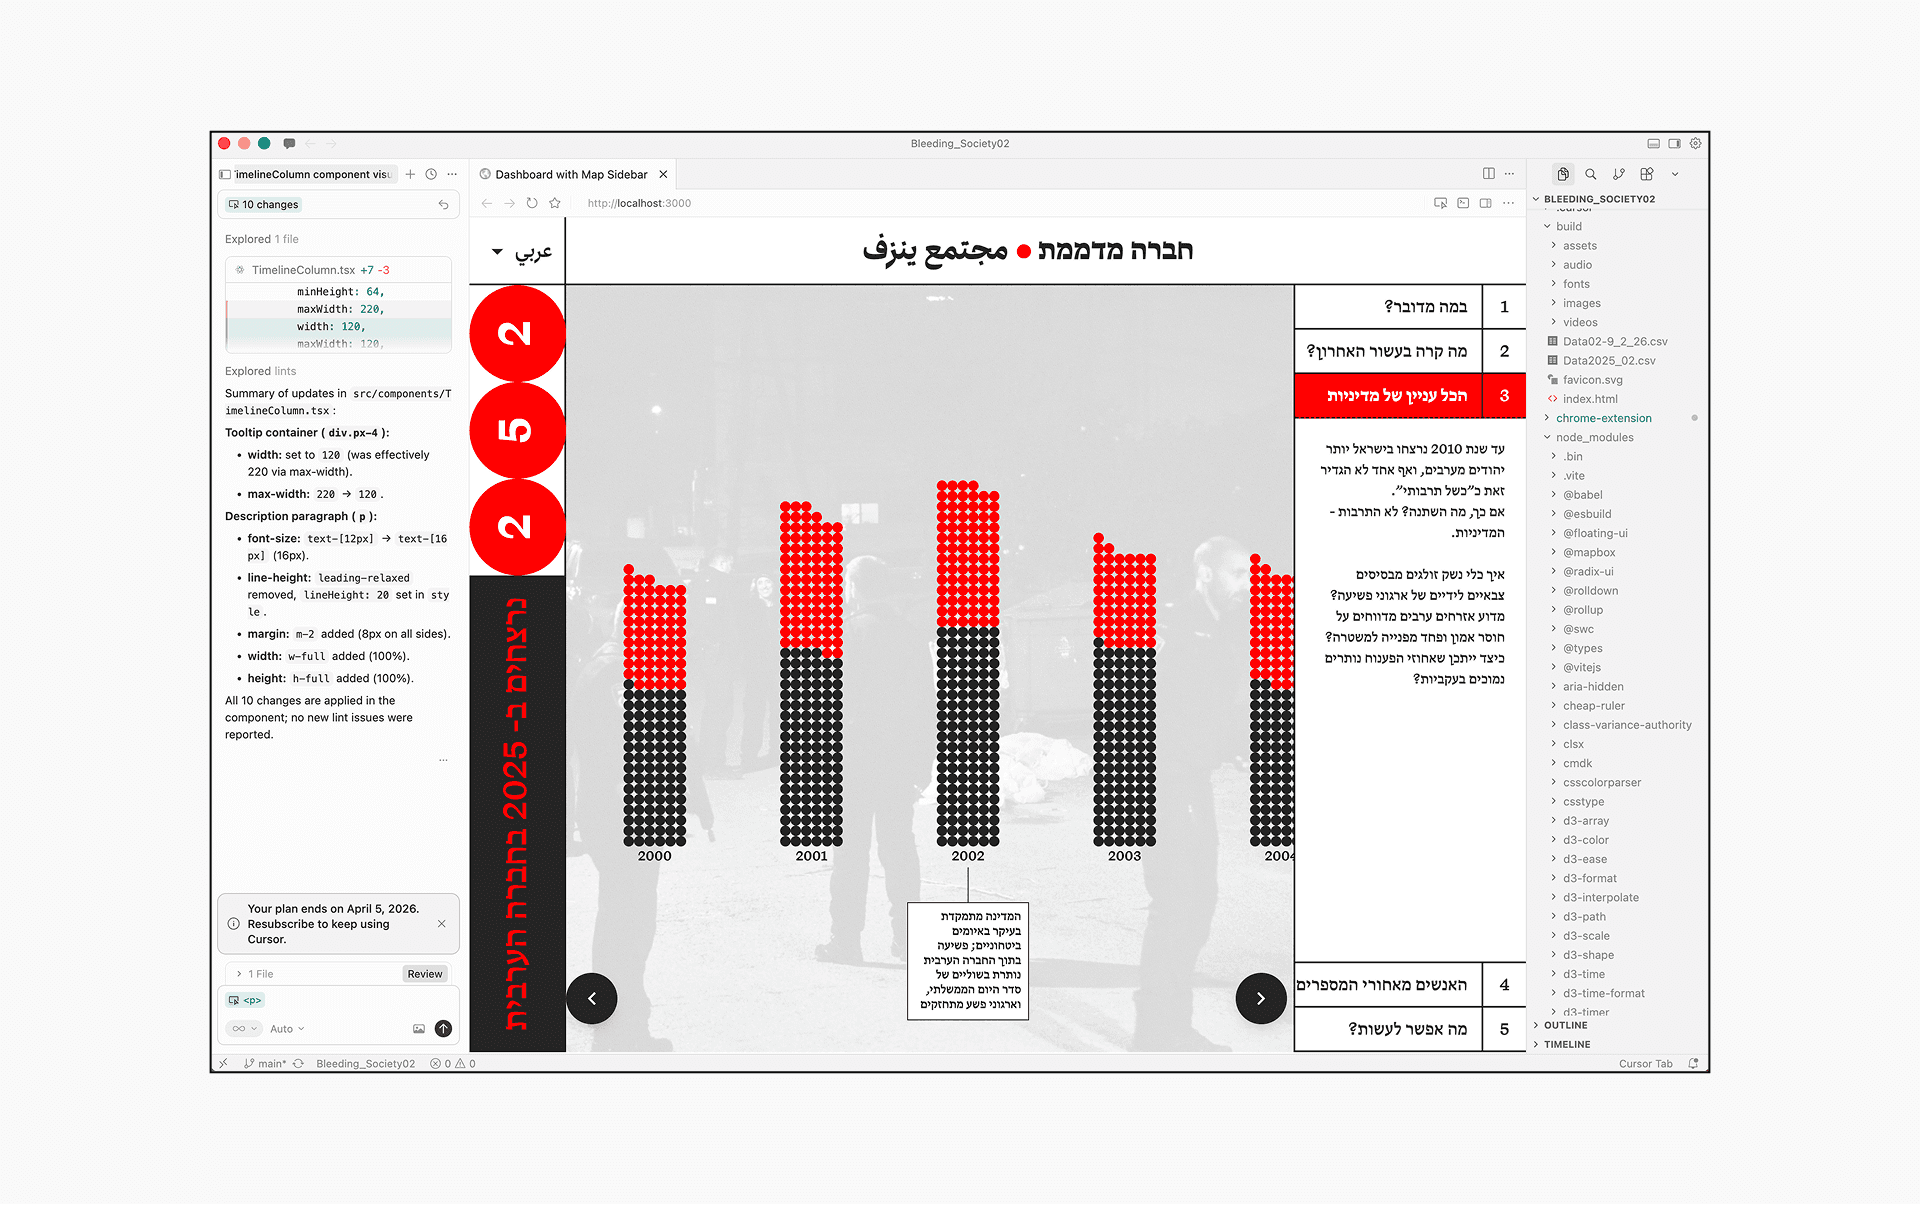
Then, I transferred the project to Figma Make, where I converted the design into code and created the basic interactions.
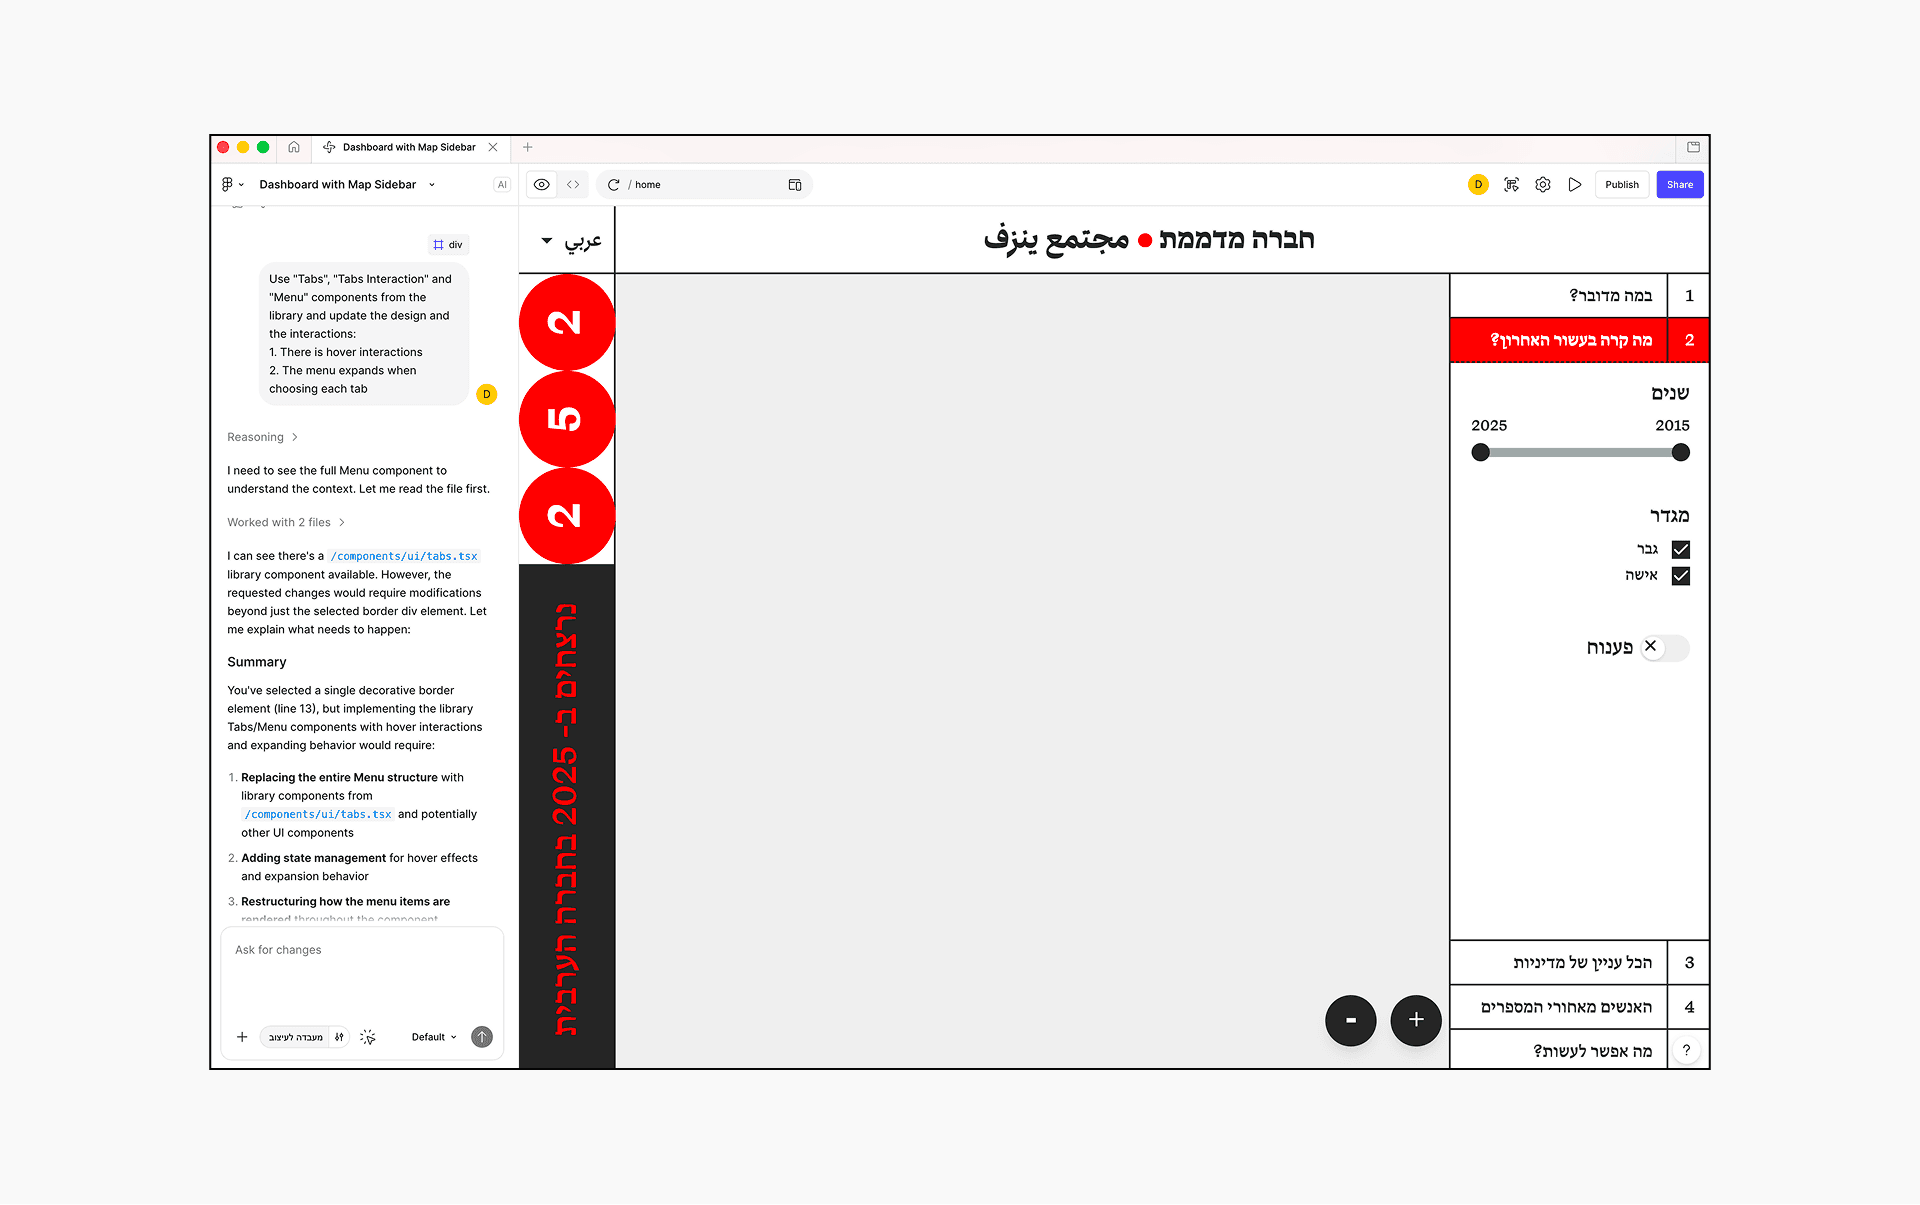
Next, I exported the codebase to Cursor, where I developed more complex interactions and logic.
This included integrating a Mapbox map with the datasets I created, connecting the map to the control menu, and building an interactive graph based on the datasets, with tooltips for additional context.